Statistics
Greenhouse Effect and Climate Change

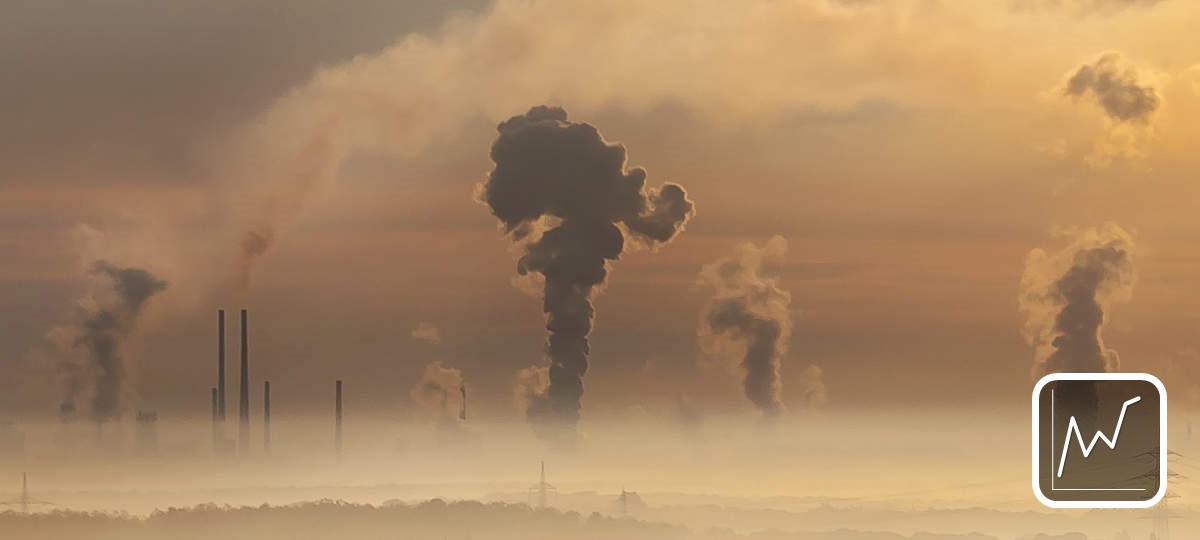
Carbon dioxide emissions in Germany
Carbon dioxide emissions in Germany also fell in 2024: the poor economy, the warmest year on record and a strong expansion of photovoltaics are the main reasons. Meeting Germany's climate protection targets for 2030 and 2045 remains unrealistic.
Global Carbon Dioxide Emissions and Concentration in Atmosphere
Only 10 countries are responsible for more than two thirds of the global carbon dioxide emissions. Despite all efforts, Germany is still among the top 10 countries with the highest energy-related emissions in 2023. Following the pandemic-related decline in 2020, record levels of global carbon dioxide emissions have been recorded again since 2021.
Specific carbon dioxide emissions of various fuels
(11-2022)Renewable Energies in Germany
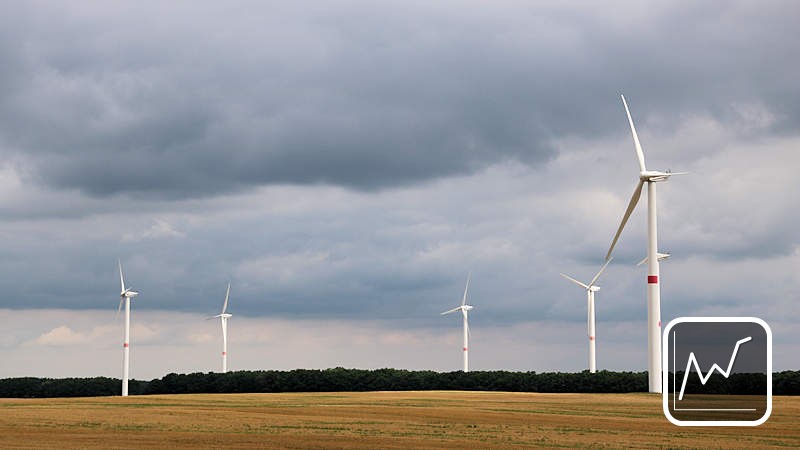
Renewable Electricity Generation in Germany
In 2024, renewable energies covered over half of Germany's gross electricity consumption. A total of 12 TWh more was produced than in the previous year, of which photovoltaics alone accounted for over 10 TWh. The expansion of renewable energies is still too slow, with onshore wind energy in particular once again falling short of expectations.
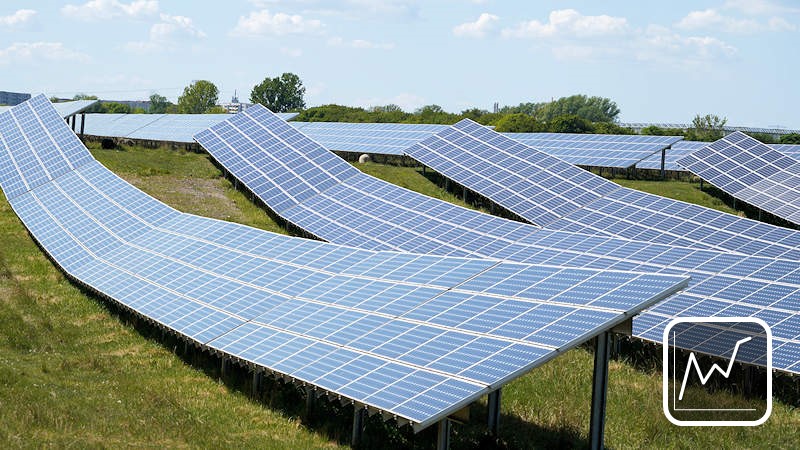
Renewable Electricity Generation Capacity in Germany
In 2024, over 18 GW of renewable energies were newly installed. Of this, 15.5 GW is expected to come from photovoltaics and 2.3 GW from wind. This could just exceed the record expansion of 2023.
Renewable Energies on global scale

Global photovoltaic capacity installations
In 2023, a new record in newly installed photovoltaic capacity was achieved worldwide. The number of solar installations grew by almost 400 gigawatts. China is responsible for around 60% of this. Despite the relatively strong expansion of 14 gigawatts, Germany remains in fifth place internationally.

Worldwide installed wind power capacity
Wind power utilisation 2023: 1000 gigawatts installed worldwide. China is by far in first place, followed by the USA. Germany was able to maintain its 3rd place. In 2023, the number of new installations in Germany also fell short of the figures from 2014 to 2017.
Miscellaneous
Data of Sun and Earth
The sun is the center point of our sun system and origin of all life. Even the fossil energy sources are stored solar energy. Most of the renewable energy sources also come directly or indirectly from the sun. The following table compares the most important data of sun and earth.